What is this about?
This blog post is kind of a learning in public exercise. The goal is to run Prometheus in my local K8s cluster and export Node metrics to it.
I’m using a cluster generated by my local_k8s project. Out of the box, this creates KVM hosted cluster on an Arch machine with an underlying NFS ready for Persisted Volumes; PRs and Issues welcome.
Creating the namespace
The first thing we want to do is create a namespace to run the monitoring resources in. I’m going to call this monitoring
kubectl create namespace monitoring
This is the logical grouping for all the resources related to monitoring to be placed, this will be the Pods, ConfigMaps, Services, Secrets etc
Access Control
This first section will configure the access control for a service account to run Prometheus for us.
Service Account
I want to run monitoring as its own dedicated service account, so lets create the manifest file for that.
# monitor-sa.yaml

apiVersion: v1
kind: ServiceAccount
metadata:
  name: monitor
  namespace: monitoring
This will create a service account in the monitoring namespace called monitor.
Create:
kubectl create -f monitor-sa.yaml
Cluster role
Now that we have a service account, we need to give some permissions to it. Using the Role Based Access Control (RBAC) for Kubernetes, this requires a dedicated role for the access that is required.
Our service account in the monitoring namespace needs to be able to access resources across the cluster, so this needs to be a ClusterRole.
# monitor-cluster-role.yaml

apiVersion: rbac.authorization.k8s.io/v1
kind: ClusterRole
metadata:
  name: monitor
rules:
- apiGroups: [""]
  resources:
  - nodes
  - services
  - endpoints
  - pods
  verbs: ["get", "list", "watch"]
This ClusterRole grants holders of the role to be able to get, list and watch a selection of resources (nodes, services, endpoints and pods).
Create:
kubectl create -f monitor-cluster-role.yaml
Binding
There is nothing linking our monitor service account to the monitor role at the moment, for this we need a ClusterRoleBinding.
# monitor-cluster-role-binding.yaml

apiVersion: rbac.authorization.k8s.io/v1
kind: ClusterRoleBinding
metadata:
  name: monitor
roleRef:
  apiGroup: rbac.authorization.k8s.io
  kind: ClusterRole
  name: monitor
subjects:
- kind: ServiceAccount
  name: monitor
  namespace: monitoring
This manifest is binding the ClusterRole monitor to the service account monitor from the monitoring namespace.
Create:
kubectl create -f monitor-cluster-role-binding.yaml
Validating Access
At this stage, we want to verify that our new service account can do what we’ve set in the permissions. To do this, we can use the auth can-i command provided by kubectl
kubectl auth can-i watch pods --as system:serviceaccount:monitoring:monitor
This command checks if the service account monitor in the monitoring namespace can watch (verb) pods (resource). Thankfully the answer is an emphatic yes
Deploying Prometheus
In this section I will cover the actual deployment of Prometheus
Configuration
Lets store the configuration for Prometheus in a config map. As everything is running in the monitoring namespace, we can create the config map there.
We need a config to put in the map, this configures the scrapes that Prometheus will perform and some additional global settings.
#prometheus.yml

global:
  scrape_interval: 15s # scrape every 15 seconds
  external_labels:
    monitor: 'cluster'

scrape_configs:
- job_name: 'prometheus'
  scrape_interval: 5s
  static_configs:
  - targets: ['localhost:9090']
- job_name: 'kubernetes-service-endpoints'
  kubernetes_sd_configs:
  - role: endpoints
  relabel_configs:
  - action: labelmap
    regex: __meta_kubernetes_service_label_(.+)
  - source_labels: [__meta_kubernetes_namespace]
    action: replace
    target_label: kubernetes_namespace
  - source_labels: [__meta_kubernetes_service_name]
    action: replace
    target_label: kubernetes_name
Create: (pay attention to creating in correct namespace)
kubectl -n monitoring create configmap prometheus-config --from-file prometheus.yml
Deployment
I’m going to deploy as a single replica for this example and use a Deployment rather than just a Pod so that any restarts are handled nicely.
# prometheus-deployment.yaml

apiVersion: apps/v1
kind: Deployment
metadata:
  name: prometheus
  namespace: monitoring
spec:
  replicas: 1
  selector:
    matchLabels:
      app: prometheus
  template:
    metadata:
      labels:
        app: prometheus
    spec:
      containers:
      - name: prometheus
        image: prom/prometheus
        volumeMounts:
        - name: config-volume
          mountPath: /etc/prometheus/prometheus.yml
          subPath: prometheus.yml
        ports:
        - containerPort: 9090
      volumes:
      - name: config-volume
        configMap:
          name: prometheus-config
      serviceAccountName: monitor
Create:
kubectl create -f prometheus-deployment.yaml
Service
Now we have the Prometheus pods running, we need a service to actually get to the UI from our browser.
# prometheus-service.yaml

kind: Service
apiVersion: v1
metadata:
  name: prometheus
  namespace: monitoring
spec:
  selector:
    app: prometheus
  ports:
  - name: promui
    nodePort: 39090
    protocol: TCP
    port: 9090
    targetPort: 9090
  type: NodePort
Viewing Prometheus
To view the dashboard lets open up Prometheus with a simple port forward, (an ingress would be better, but this is quicker)
First, find the name of the pod
kubectl get pods -n monitoring
Making a note of the Pod name, we can create a port forward
kubectl port-forward -n monitoring prometheus-deployment-6559cbc88b-9m9hv 8080:9090
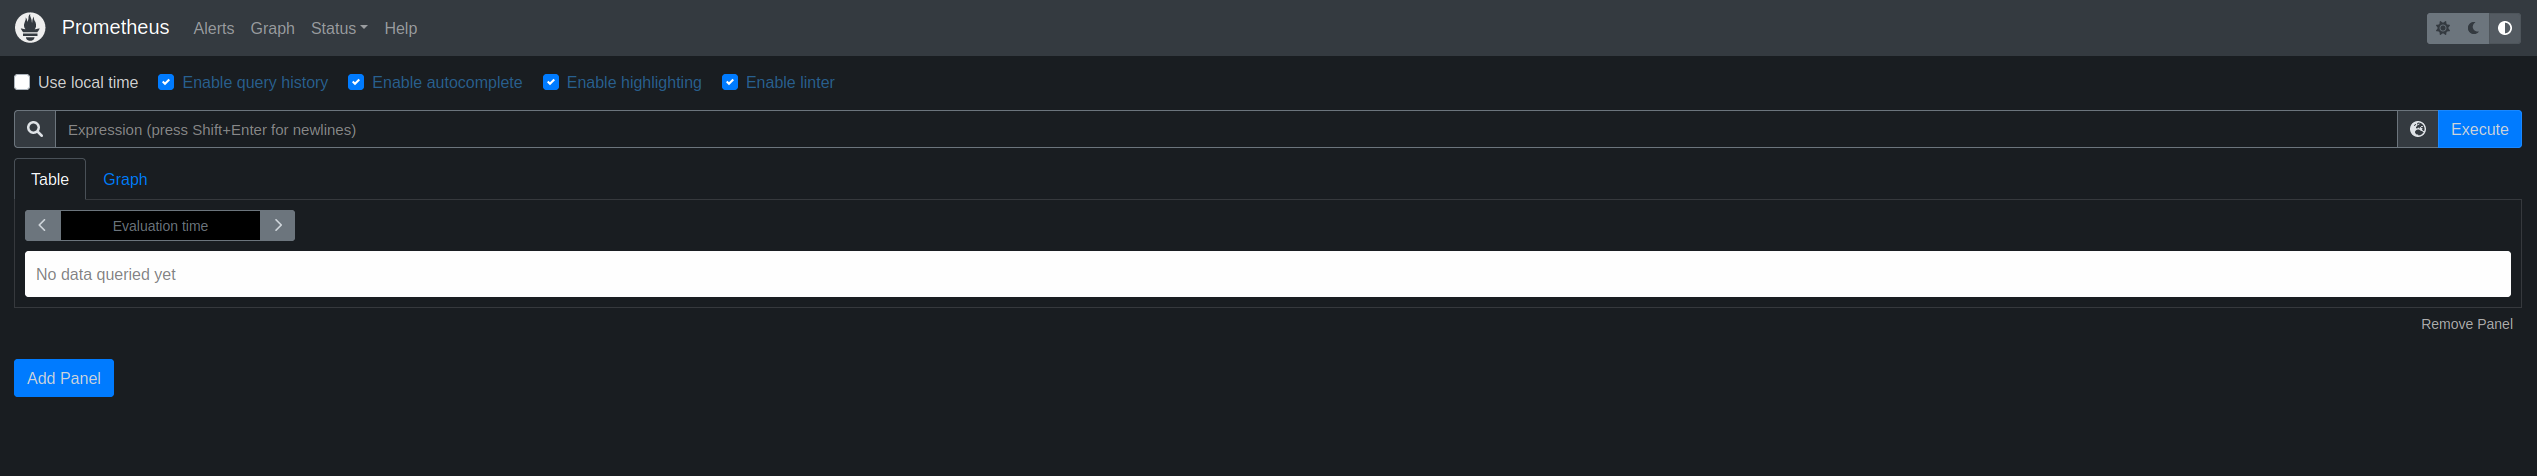
Now if we browse to http://localhost:8080 we can see the Prometheus dashboard.
Node Exporter
There are a few more steps to see the Node Exporter metrics
Adding Exporter Pod
We need a pod per node to get the metrics, so the clear choice is deploying as a DaemonSet. These pods will run in the monitoring namespace.
# node-exporter-daemonset.yaml

apiVersion: apps/v1
kind: DaemonSet
metadata:
  labels:
    app.kubernetes.io/component: exporter
    app.kubernetes.io/name: node-exporter
  name: node-exporter
  namespace: monitoring
spec:
  selector:
    matchLabels:
      app.kubernetes.io/component: exporter
      app.kubernetes.io/name: node-exporter
  template:
    metadata:
      labels:
        app.kubernetes.io/component: exporter
        app.kubernetes.io/name: node-exporter
    spec:
      containers:
      - args:
        - --path.sysfs=/host/sys
        - --path.rootfs=/host/root
        - --no-collector.wifi
        - --no-collector.hwmon
        - --collector.filesystem.ignored-mount-points=^/(dev|proc|sys|var/lib/docker/.+|var/lib/kubelet/pods/.+)($|/)
        - --collector.netclass.ignored-devices=^(veth.*)$
        name: node-exporter
        image: prom/node-exporter
        ports:
          - containerPort: 9100
            protocol: TCP
        volumeMounts:
        - mountPath: /host/sys
          mountPropagation: HostToContainer
          name: sys
          readOnly: true
        - mountPath: /host/root
          mountPropagation: HostToContainer
          name: root
          readOnly: true
      volumes:
      - hostPath:
          path: /sys
        name: sys
      - hostPath:
          path: /
        name: root
Note that we’re mounting sys and root from the host to be able to read from the host.
Create:
kubectl create -f node-exporter-daemonset.yaml
Node Exporter
For the metrics to be surfaced we need a service for the node-exporter. Again this will be running in the monitoring namespace.
# node-exporter-service.yaml

kind: Service
apiVersion: v1
metadata:
  name: node-exporter
  namespace: monitoring
  annotations:
      prometheus.io/scrape: 'true'
      prometheus.io/port:   '9100'
spec:
  selector:
      app.kubernetes.io/component: exporter
      app.kubernetes.io/name: node-exporter
  ports:
  - name: node-exporter
    protocol: TCP
    port: 9100
    targetPort: 9100
node-exporter-service.yaml
Adding a scrape job
The last thing left, we need to add a job to prometheus.yml and update the config map.
- job_name: 'node-exporter'
  kubernetes_sd_configs:
  - role: endpoints
  relabel_configs:
  - source_labels: [__meta_kubernetes_endpoints_name]
    regex: 'node-exporter'
    action: keep
This adds a job that will look for node exporter metrics.
Checking the end result
Now we can create the port forward again
kubectl port-forward -n monitoring prometheus-deployment-6559cbc88b-94dsf 8080:9090
We can see a number of metrics now in the metrics explorer. Try adding the expression node_memory_MemFree_bytes and pressing Execute button.
Over a period of time, this will give you a graph of free memory for the nodes in your cluster.
{:target=”_blank”}